
Slay the SPiDeR Newsletter 2021-09-27
Slay the SPiDeR Newsletter 2021-09-27
2021 09 27
Here is this week’s video…
I feel like I am witnessing history repeating itself.
Last week Monday, 9/20, at one point the DJIA was down 971 points, 2.81% in a single day. I decided to do some investigation into big down days.
There have been 5469 market trading days since the turn of the millenium, this century, 1/1/2000 - 9/27/2021.
The S&P has declined over 3% on a single day on just 90 of those days.
The S&P has declined over 5% on a single day is just 19 of those 90 days.
Of those 19 days down -5% or worse:
1 happened in the dot-com era. 14-Apr-00 down -5.8%
1 happened in the Greek/Euro crisis in 2011. 8-Aug-11 -6.8%
5 happened in the Pandemic crash on March 9, 12, 16, 18, 2020 and June 11, 2020.
12 happened in the Financial Crisis, and all in about a 70-trading day stretching from 9/28/08 - 1/9/09.
In the month of Sept. 2008, there were 5 days with the S&P declining 3%-5%, and then Sept. 28 down 8.8%. There were also 3 days with the S&P up 3-5%, plus Sept. 30 up 5.4%.
Crazy volatility!

Here is a link to events (with details) in the Financial crisis in 2008:
https://www.thebalance.com/2008-financial-crisis-timeline-3305540
First, Pay particular attention to the period 9/2/2008 - 11/4/2008. That period was substantially the end of the SlaytheSPiDeR 4O’clock loop.
The 4 O’clock Loop (Major) Downturn was 9/2/2008 - 10/11/2008.
Then a rally and double bottom, from 10/11 (at S&P 839) to 10/27 (at S&P 846).
Next a short rally 10/27 - 11/4 (at S&P 1005).
Here is a chart of that 2-month period in 2008 in the 4 O’Clock Loop.
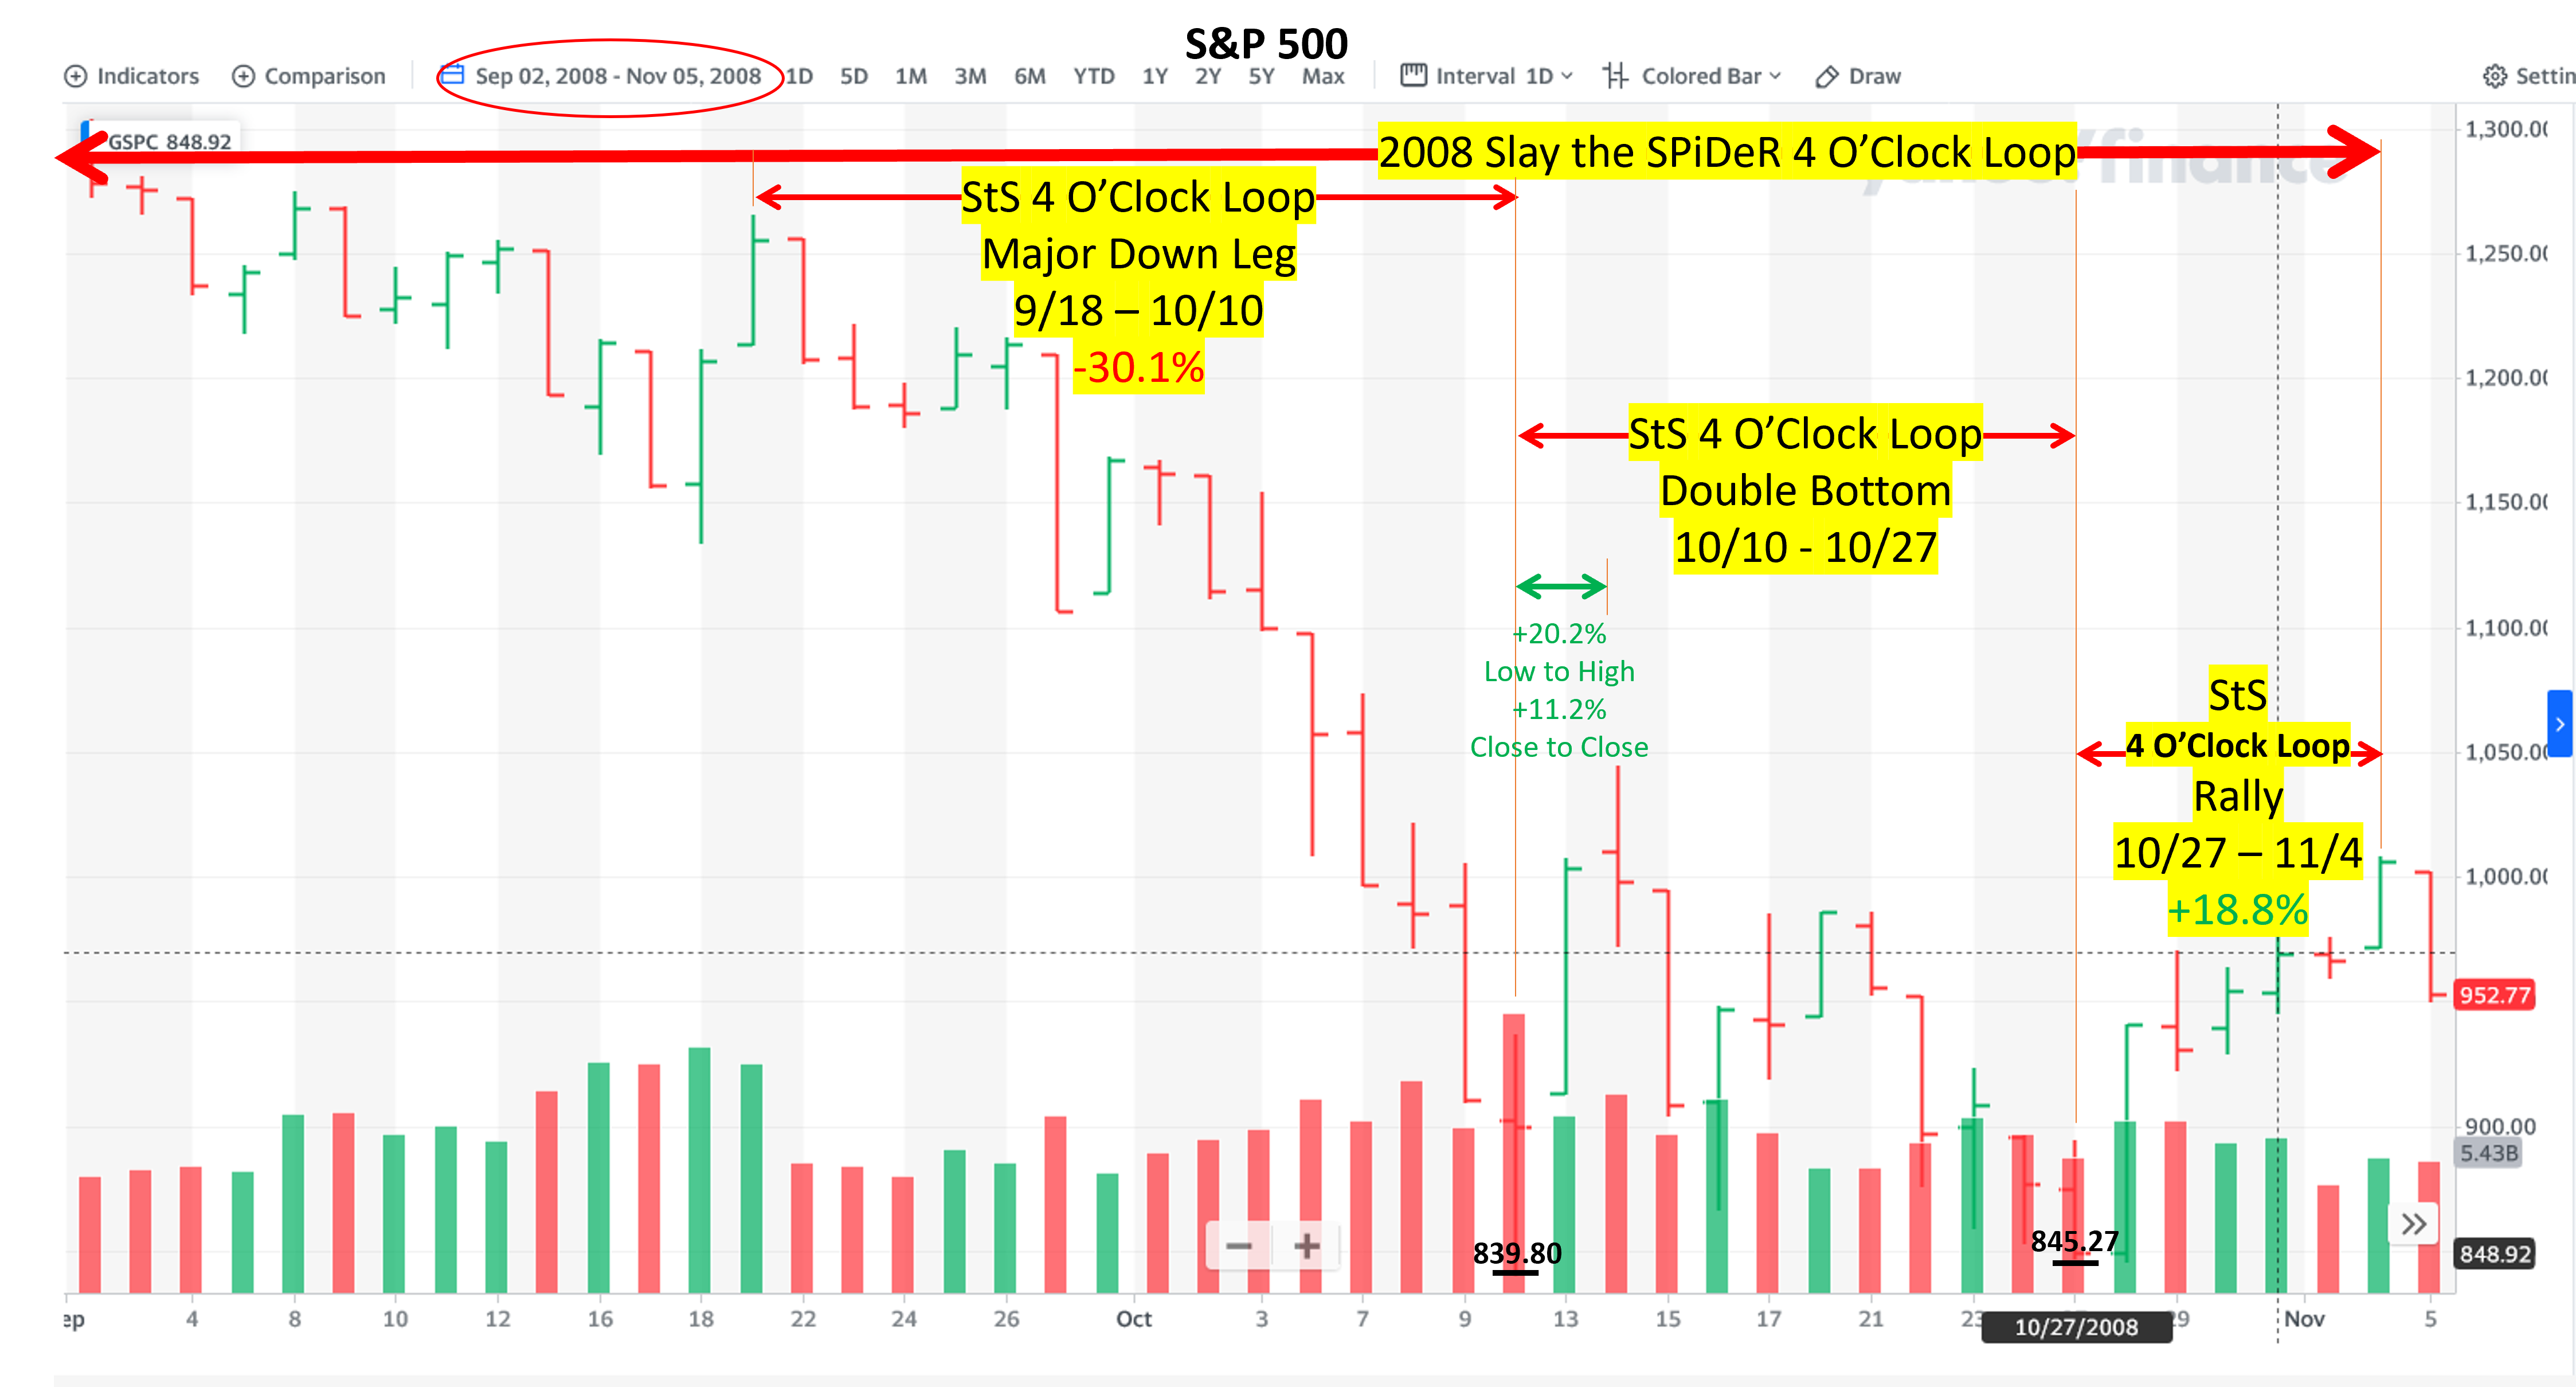
Click on the image and enlarge it.
It is a daily Open-Hi-Lo-Close chart of the S&P 500 from 9/2/2008 - 11/5/2008
Be sure to read my Changing My Life article and video out in the next 24 hours or so to understand why this is important, and what I have been working on.
Let’s Go Get the Money
or Keep What we Have Now
JimB